Debug Visualizations
I implemented basic debug visualizations.
These overlays are Unity-only proof of concepts since I don’t have a runtime UI implementation yet. But I wanted to test and verify the explorability of LunyScript details early-on.
This will eventually work across engines once the necessary UI adapters have been implemented as Luny engine services.
I’m also exploring accelerating the engine-native bindings via code-gen and configuration. This could significantly bootstrap future engine and feature-level API integrations. More on this once I have the details fleshed out …
On-Screen Variables
This shows the state of global variables (top-left) and the selected object’s local variables:
For readability, here’s what the global variables show:
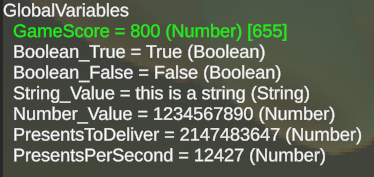
A monospace font, checkboxes for booleans, and thousands separators for large numbers will certainly enhance readability. And they should be editable of course.
On-Screen Profiling Stats
Similar onscreen information from the built-in profiler, which gathers statistics of Luny engine observers:
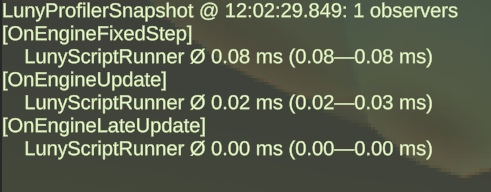
An ‘observer’ is any script that builds on top of the Luny framework - like LunyScript. Since there may eventually be multiple in a project it’s good to see which of these Luny sub-engines are consuming how much of time without needing to dig into engine-native profilers.
Side-Note: Stars and Lines
I have this GitHub star progress counter at the top. Yes, the January 15th milestone fell 25 short of the #100 goal despite reaching #50 ten days early. Xmas holidays are partially to blame, as well as me just picking arbitrary milestone dates without “running the numbers”.
What really matters is that every new star makes me happy. Every day there’s 2+ new stars I feel like I’m really doing something valuable! So keep those stars coming! 😄
Of all the projects I put up on GitHub over the past five years (not showing all the ‘private’ repos) LunyScript clearly stands out!
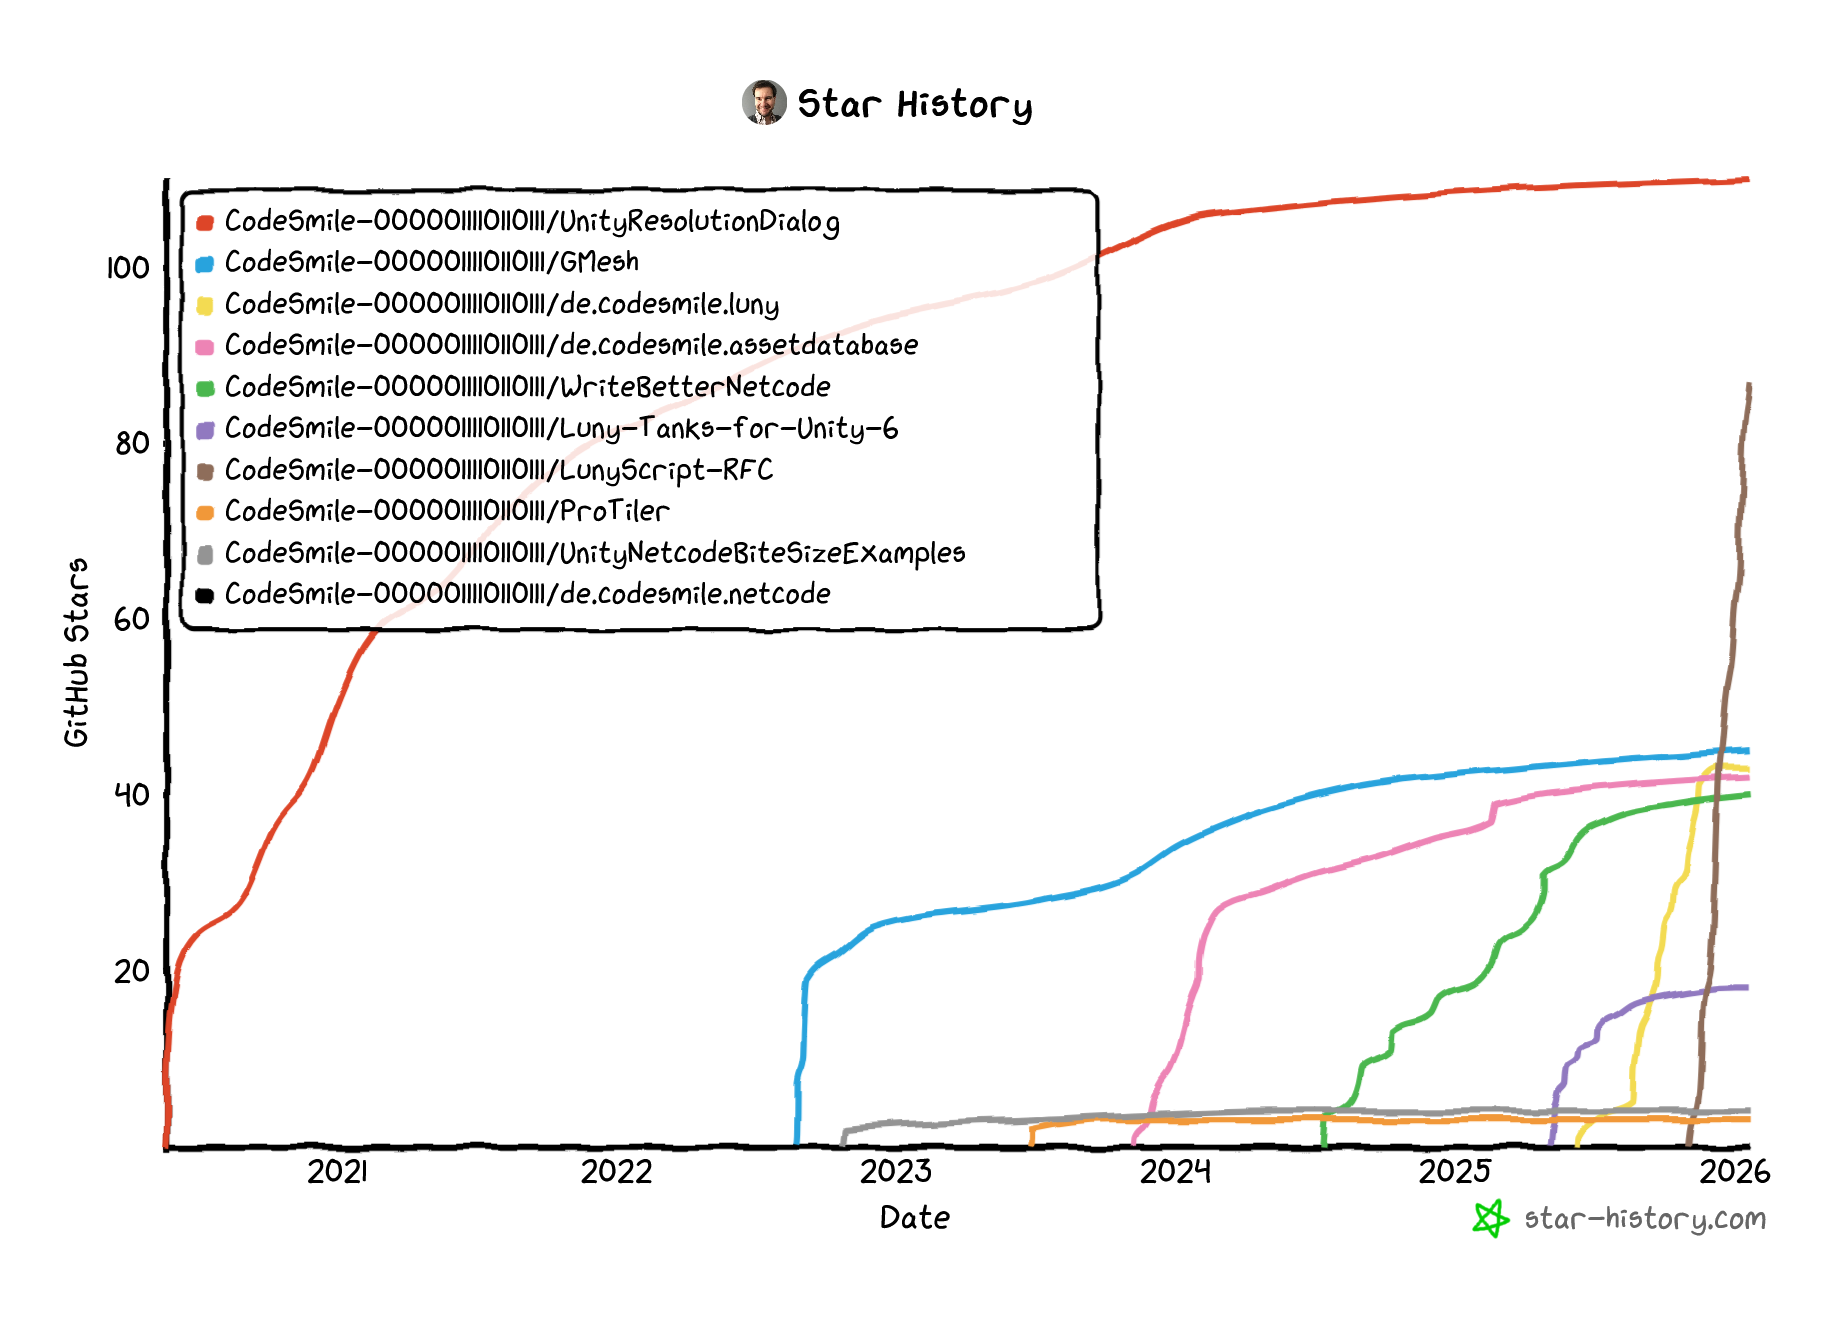 Click on the image to view the latest version of the chart.